A 58-year-old woman with type 2 diabetes mellitus with complications of diabetic nephropathy, dialysis dependent end stage renal disease (ESRD), and bipolar disorder presented with a sudden onset of restlessness, dizziness, slurred speech, and ataxic gait. She reported episodes of symptomatic hypoglycemia beginning 2 weeks prior to this presentation. She regularly attended her outpatient hemodialysis sessions and did not have any episodes of hypotension. She was adherent to her medication regimen of glargine, metformin, gabapentin, paroxetine, and quetiapine. She did not use illicit substances nor consume alcohol. On exam, she was afebrile, heart rate 73 beats/minute, blood pressure 132/68 mmHg, respiratory rate 16, oxygen saturation 97% on ambient air. On neurologic examination, she showed involuntary choreiform movements of her upper and lower extremities. Her cranial nerve exam was intact and symmetrical. Strength and sensation were symmetrically intact. Bicep and patellar reflexes were 2+ and symmetric. She did not have any myoclonus on examination. Her gait was wide based and ataxic.
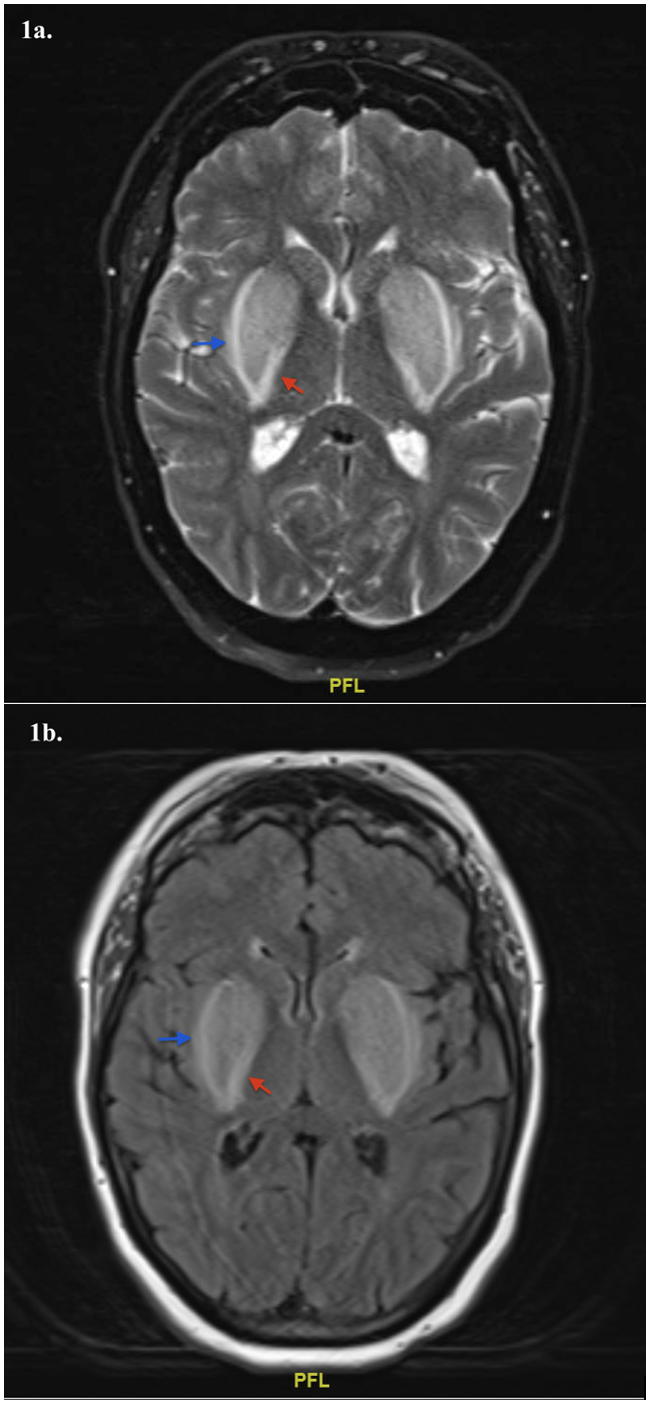
Laboratory studies were significant for a serum lactate of 5.3 mEq/L (ref: 0.2 – 1.9 mEq/L), beta hydroxybutyrate 4.23 mMol/L (ref: 0.02 – 0.27 mMol/L), blood urea nitrogen 41 mg/dL (ref: 6 - 24 mg/dL), serum creatinine 7.82 mg/dL (ref: 0.44 - 1.03 mg/dL), blood glucose 65 mg/dL (ref: 67 - 99 mg/dL). Venous blood gas showed pH 7.33 (ref: 7.32 – 7.42) and pCO2 36 mmHg (ref: 42 – 50 mmHg). Quantitative metformin levels were elevated to 10.0 mcg/mL (therapeutic range 1.0 to 2.0 mcg/mL). Gabapentin levels were undetectable. Her most recent hemoglobin A1c was 5.0 (ref: 4.3 -5.6%). Testing for carbon monoxide, cyanide, volatile alcohols, and toxicology screens were negative. Magnetic resonance imaging (MRI) of the brain without contrast showed bilateral, symmetric hyperintense signal of the lentiform nuclei outlined by a thin hyperintense rim on T2-weighted (Figure 1a) and FLAIR (Figure 1b) sequences consistent with the “Lentiform Fork sign”. Her symptoms improved with hemodialysis and discontinuation of metformin. She was diagnosed with metformin-induced encephalopathy with a type B lactic acidosis given toxic metformin levels in the setting of end stage renal disease and transient hypoglycemia.
_and_fluid-attenuated_inversion_recovery_(flair__b.png)
The Lentiform Fork sign (LFS) is a characteristic finding on brain MRI described by bilateral, symmetric hyperintensities in the basal ganglia, surrounded by a hyperintensity of the white matter surrounding the lentiform nuclei (internal and external capsules).1 The basal ganglia (BG) are vital to modulating voluntary movements and have high baseline metabolic demands, rendering these structures vulnerable to toxic, metabolic, and hypoxic insults.2 The “fork” represents white matter edema of the internal and external capsules, signaling impaired vascular autoregulation and vasogenic edema, leading to disruption of the blood-brain barrier.3 This appearance is secondary to differences in metabolic vulnerability between basal ganglia neurons and astrocytes.3 Metformin is commonly used in the treatment of type 2 diabetes mellitus, acting via inhibition of mitochondrial complex I of the respiratory chain to inhibit ATP production, leading to decelerated gluconeogenesis4,5 and increased lactate production.6 Metformin-induced encephalopathy is a manifestation of cerebral dysfunction and may be attributable to the vulnerability of mitochondria to metformin within the lentiform nuclei, leading to focal lactate accumulation within the brain.7 Clinical manifestations from basal ganglia injury range from confusion, tremors, parkinsonism, convulsions, and coma. Imaging findings and symptoms are often reversible with correction of the acidosis and removal of any identifiable triggers.
LFS can indicate severe metabolic acidosis,8 but has been described in other settings, including toxin exposure (i.e. alcohol, methamphetamine),9 hypoglycemia, uremia, and hypoxia,10 amongst others. Metabolic acidosis in our case was secondary to metformin-induced lactic acidosis (MALA) and transient hypoglycemia in the setting of concomitant insulin use. Clinicians should be aware of the contraindication of metformin use in patients with a glomerular filtration rate (GFR) < 30 mL/minute/1.732 due to the increased risk of lactic acidosis. Features of gabapentin toxicity, include somnolence, akathisia, parkinsonism was unlikely due to an undetectable gabapentin level. Uremia was an unlikely culprit given her well documented adherence to her outpatient dialysis schedule.
Disclosures/Conflicts of Interest
The author declares that there are no conflicts to report.
Corresponding Author
Michael A. Santos MD
Department of Medicine
Warren Alpert Medical School of Brown University
The Miriam Hospital, Providence, RI
Email: michael_santos2@brown.edu
Phone: (401) 793-2104